International Journal of Applied Science and Engineering
Published by Chaoyang University of Technology

Yi-Chi Tsaia and Tsung-Nan Choub*

aDepartment of Computer Science and Information Engineering, Chaoyang University of Technology, Taichung, 413, Taiwan, R.O.C.
bDepartment of Finance, Chaoyang University of Technology, Taichung, 413, Taiwan, R.O.C.


Download Citation: |
Download PDF


ABSTRACT


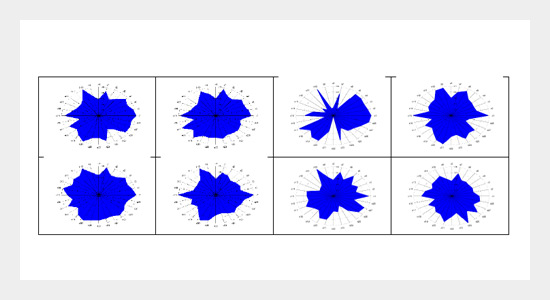
In recent years, small businesses and companies across industries have confronted the challenges of big data analysis since a huge amount of time series and cross-sectional data are collected daily from their business activities. These data might require dimensionality reduction to reduce the complexity of data analysis. This study used two special feature patterns including polar and contour graphs to represent the mutual relationship of the Asian stock markets, and geometric and invariant measures were applied to replace the original variables with an attempt to reduce the dimensionality of input variables.
Moreover, several feature selection and extraction methods were also implemented with predictive models in comparison to the effectiveness of proposed feature patterns. Three conventional machine-learning approaches were employed as benchmark models to predict the daily change of Taiwan stock market index based on the transformed graphs. In addition, the predictive performance of another three deep learning approaches including stacked autoencoder, deep neural network, and convolution neural network were evaluated with different network structures and feature selection strategies. Based on organizing the input variables as multivariate time series and two-dimensional encoded images, the experiment results showed that the deep learning models outperformed other machine learning models. Especially, the predictive accuracy of the CNN model with 1D convolution improved the predictive accuracy to 0.67 with a precision of 0.51 and a recall of 0.55, respectively. The results also suggested that the transformation of two-dimensional polar and contour graphs might provide abstract features for the deep learning approaches to explore the historical patterns. As the CNN models with 1D and 2D convolution performed better than the rest of deep learning models, the further studies might be needed to investigate how both models complement each other to create synergies.


Keywords: Deep learning; dimensionality reduction; polar graph; contour mapping.


Share this article with your colleagues


REFERENCES


  1. [1] Khalid, S., Khalil, T., and Nasreen S. 2014. A Survey of Feature Selection and Feature Extraction Techniques in Machine Learning, IEEE Science and Information Conference, 372-378.

  2. [2] Engel D., Hüttenberger L., and Hamann B. 2014. A Survey of Dimension Reduction Methods for High-dimensional Data Analysis and Visualization, LNCS Springer, 1-16.

  3. [3] Pechenizkiy M., Puuronen S., and Tsymbal A. 2008. Feature Extraction for Classification in the Data Mining Process, International Journal Information Theories & Applications, 10 : 271-278.

  4. [4] Delac, K., Grgic, M. and Grgic, S. 2005. Independent comparative study of PCA, ICA, and LDA on the FERET data set, J. Imaging Syst. Technol, 15 : 252-260.

  5. [5] Ramlee, R., Muda, A.K. and Syed Ahmad, S.S. 2013. PCA and LDA as dimension reduction for individuality of handwriting in writer verification, International Conference on Intelligent Systems Design and Applications (ISDA), 104-108.

  6. [6] Anaraki, J.R. and Eftekhari, M. 2013. Rough set based feature selection: A Review, The 5th Conference on Information and Knowledge Technology, Shiraz : 301-306.

  7. [7] Galathiya, A.S., Ganatra, A.P. and Bhensdadia, C.K. 2012. Improved Decision Tree Induction Algorithm with Feature Selection, Cross Validation, Model Complexity and Reduced Error Pruning, International Journal of Computer Science and Information Technologies, 3, 2 : 3427-3431.

  8. [8] Yager, R.R. 1989. On the Dempster-Shafer Framework and New Combination Rules, Information Science, 41, 2: 93-137.

  9. [9] Mathon, B.R., Ozbek, M.M., and Pinder, G.F. 2010. Dempster–Shafer Theory Applied to Uncertainty Surrounding Permeability, Mathematical Geosciences, 42, 3 : 293-307.

  10. [10] Guyon, I., Gunn, S., Nikravesh, M., and Zadeh, L.A. 2006. “Feature extraction: foundations and applications” (Studies in Fuzziness and Soft Computing), Springer-Verlag.

  11. [11] Bencharef, O., Fakir, M., Minaoui, B., Hajraoui, A., and Oujaoura, M. 2012. Color objects recognition system based on artificial neural network with Zernike, Hu & Geodesic descriptors, 2012 6th International Conference on Sciences of Electronics, Technologies of Information and Telecommunications (SETIT), 338-343.

  12. [12] Schubert, J. 2011. Conflict management in Dempster–Shafer theory using the degree of falsity, International Journal of Approximate Reasoning, 52, 3 : 449-460.

  13. [13] Witten, I.H., Frank, E., Hall, M.A., and Pal, C.J. 2016. “Data Mining: Practical machine learning tools and techniques”, Morgan Kaufmann.

  14. [14] Liu, W., Wang, Z., Liu, X., Zeng, N., Liu, Y., and Alsaadi, F.E. 2017. A survey of deep neural network architectures and their applications, Neurocomputing, 234 : 11-26.

  15. [15] Schmidhuber, J. 2015. Deep learning in neural networks: An overview, Neural Networks, 61 : 85-117.

  16. [16] Krizhevsky, A., Sutskever, I., and Hinton, G.E. 2012. Imagenet classification with deep convolutional neural networks, In Advances in neural information processing systems, 1097-1105.

  17. [17] Vedaldi, A. and Karel L. 2015. Matconvnet: Convolutional neural networks for matlab, Proceedings of the 23rd ACM international conference on Multimedia, ACM.

  18. [18] Chou T.N. 2017. Stock Trends Prediction Using the Feature Pattern Constructed with the Panel Data of Asian Stock Markets, Proceedings of 2017 International Workshop on Computer Science and Engineering, 1296-1301.


ARTICLE INFORMATION


Received: 2017-11-01
Revised: 2018-07-04
Accepted: 2018-07-05
Available Online: 2018-12-01


Cite this article:

Tsai, Y.C., Chou, T.N. 2018. Deep learning applications in pattern analysis based on polar graph and contour mapping. International Journal of Applied Science and Engineering, 15, 183-198. https://doi.org/10.6703/IJASE.201812_15(3).183