a College of Management, National Taipei University of Technology, Taipei, Taiwan, ROC PhD Candidate a Department of Industrial Engineering and Management, Chaoyang University of Technology, Taichung County, Taiwan, ROC b Collage of Management, National of Industrial Engineering and Management, No.1, Sec. 3, Chuan-Hsiao East Road, Taipei, 10608, Taiwan, ROC
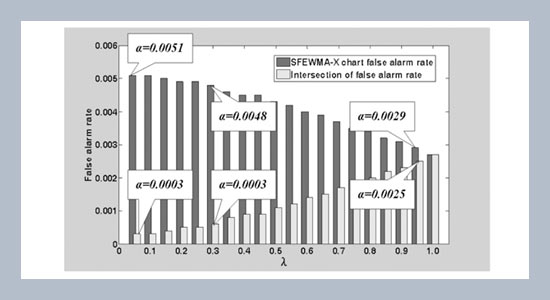
Quality control chart is an important tool for process monitoring and quality improvement. Several combined control charts have been proposed to enhance the detection ability in detecting small and large process parameter changes. However, two pairs of control limits and statistics on the control chart make the combined charts too complicated for the practitioners to use in practice. We have developed a single-featured EWMA-X (SFEWMA-X) control chart in previous study, which has the ability to monitor both large and small process shifts simultaneously using only one set of statistic and control limits. In this study, we presented an example to demonstrate the use of the SFEWMA-X chart, and performed the average run length (ARL) comparison between SFEWMA-X chart and the individual control charts to illustrate the detection ability of the SFEWMA-X chart. To facilitate the implementation of the proposed method in practice, we also introduced the algorithm for deriving optimal chart design tables.
Keywords: EWMA; combined EWMA-X; process shift detection; average run length; ARL.
Share this article with your colleagues
REFERENCES
[1] Shewhart, W. A. 1931. “Economic Control of Quality of Manufactured Product”. Van Nostrand, New York.
[2] Roberts, S. W. 1959. Control chart tests based on geometric moving average. Technomertics, 1: 239-250.
[3] Hunter, J. S. 1986. The exponentially weighted moving average. Journal of Quality Technology, 18: 203-210.
[4] Crowder, S. V. 1987. A simple method for studying run-Length distribution of exponentially weighted moving average charts. Technometrics, 29: 401-407.
[5] Lucas, J. M. and Saccucci, M. S. 1990. Exponentially weighted moving average control Scheme: properties and enhancement. Technometrics, 32: 1-12.
[6] Neubauer, A. S. 1997. The EWMA control chart: properties and comparison with other quality-control procedures by computer simulation. Clinical Chemistry, 43: 594-601.
[7] Woodall, W. H. and Maragah, H. D. 1990. Discussion. Exponentially weighted moving average control schemes: properties and enhancements. Technometrics, 32: 1-29.
[8] Klein, M. 1996. Composite She-whart-EWMA statistical control schemes. IIE Transactions, 28: 475-481.
[9] Tolley, G. O. and English, J. R. 1999. Economic design of constrained EWMA and combined EWMA- X control scheme. IIE Transactions, 33: 429-436.
[10] Zhang, L., Bebbington, M. S., Govindaraju, K. and Lai, C. D. 2004. Composite EWMA control charts. Communication in Statistics:Simulation and Computation, 33: 1133-1158.
[11] Serel, D. A. and Moskowitz, H. 2008. Joint economic design of EWMA control charts for mean and variance. European Journal of Operational Research, 184: 157-168.
[12] Hawkins, D. M. and Deng, Q. 2009. Combined charts for mean and variance Information. Journal of Quality Technology, 41: 415-425.
[13] Sheu, S. H. and Lu, S. L. 2009. The effect of auto-correlated observations on a GWMA control chart performance. International Journal of Quality and Reliability Management, 26: 112-128.
[14] Simões, B. F. T., Epprecht, E. K. and Costa, A. F. B. 2010. Performance comparisons of EWMA control chart schemes. Quality Technology & Quantitative Management, 3: 249-261.
[15] Albin, S. L., Kang, L., and Shea, G. 1997. An X and EWMA chart for individual observations. Journal of Quality Technology, 29: 41-48.
[16] Reynolds, M. R. and Stoumbos, Z. G. 2001. Individuals control schemes for monitoring the mean and variance of process subject to drifts. Stochastic Analysis and Applications, 19: 863-892.
[17] Reynolds, M. R. and Stoumbos, Z. G. 2001. Monitoring the process mean and variances using individual observations and variable sampling intervals. Journal of Quality Technology, 33: 181-205.
[18] Stoumbos, Z. G. and Reynolds, M. R. 2005. Economic statistical design of adaptive control schemes for monitoring the mean and variance: an application to analyzers. Nonlinear Analysis, 6: 817-844.
[19] Liu, C. S. and Tien, F. C. 2011. A single-featured EWMA-X control chart for detecting shifts in process mean and standard deviation. Journal of Applied Statistics. (accepted January 2011)
[20] Sheu, S. H., and Lin, T. C. 2003. The generally weighted moving average control chart for detecting small shifts in the process mean. Quality Engineering, 16: 209-231.
ARTICLE INFORMATION
Accepted: 2011-04-25 Available Online: 2011-06-01
Cite this article:
Liu, C.-S., Tien, F.-C. 2011. An evaluation of single-featured EWMA-X (SFEWMA-X) control chart with process mean shifts and standard de-viation changes. International Journal of Applied Science and Engineering, 9, 111–121. https://doi.org/10.6703/IJASE.2011.9(2).111