International Journal of Applied Science and Engineering
Published by Chaoyang University of Technology

Kenji Yamaguchi1, Yukari Shirota2*

1 Science & Education Center, Ochanomizu University, Tokyo, Japan
2 Faculty of Economics, Gakushuin University, Tokyo, Japan


Download Citation: |
Download PDF


ABSTRACT


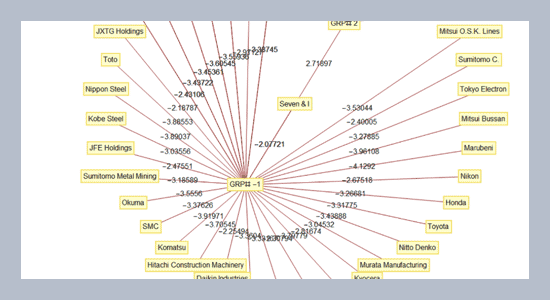
The address by President Trump on the trade between US and China in May, 2019 had a significant and global influence on manufacturing companies. In this paper, we extracted the stock price decline patterns due to the address by using Singular Value Decomposition Method with the intention of introducing a new approach to measure patterns of effects of such contingencies which happen once in a while on stock prices. The results are expected to have also meaningfulness for investors as well as analysts. Our analyses include two types. The first analysis focuses on the extraction of patterns among companies which have high intensity of business engagement in China and the second one among counties. In the first analysis we used only Japanese companies’ data because of data availability. As to the second analysis, we used only machinery industry’s data of Germany, Japan and US which compete in the global market and have mature stock markets respectively. The analyses made differences of patterns among businesses such as B-to-B and B-to-C stand out in the first analysis and differences among countries in the second analysis. Those results are expected to inspire further research, especially, exploration of new methodologies in the area of analysis of stock price fluctuations due to economic crises such as global trade or political affairs.


Keywords: Disastrous impact on stock prices, US-China trade friction, Singular value composition.


Share this article with your colleagues


REFERENCES


  1. Anderson, G.W., Guionnet, A., Zeitouni, O. 2009. An introduction to random matrices (Cambridge studies in advanced mathematics). Cambridge University Press.

  2. Bishop, C.M., 2006. Pattern recognition and machine learning. Springer.

  3. Bouchaud, J.-P., Potters, M., Akemann, G., Baik, J., Francesco, P.D. Eds. 2011. Financial applications of random matrix theory (The oxford handbook of random matrix theory). Oxford University Press.

  4. Friedman, J., Tibshirani, R., Hastie, T. 2013. The elements of statistical learning: data mining, inference, and prediction: with 200 full-color illustrations, ed: Springer.

  5. Granato, D., Santos, J.S., Escher, G.B., Ferreira, B.L., Maggio, R.M. 2018. Use of principal component analysis (PCA) and hierarchical cluster analysis (HCA) for multivariate association between bioactive compounds and functional properties in foods: A critical perspective, Trends in Food Science & Technology, 72, 83–90.

  6. Kolanovic, M., Krishnamachari, R.T. 2017. Big data and AI strategies. J.P. Morgan.

  7. Konstantinov, G., Chorus, A., Rebmann, J. 2020. A network and machine learning approach to factor, Asset, and blended allocation, The Journal of Portfolio Management, no. Multi-Asset Special Issue 1–18.

  8. Koutroumbas, K., Theodoridis, S. 2009. Pattern recognition (4th edition), ed: Elsevier.

  9. Kriegel, H.-P., Kröger, P., Schubert, E., Zimek, A. 2008. A general framework for increasing the robustness of PCA-based correlation clustering algorithms, in International Conference on Scientific and Statistical Database Management, Springer, 418–435.

  10. Lee, A.J., Lin, M.-C., Kao, R.-T., Chen, K.-T. 2010. An effective clustering approach to stock market prediction, in PACIS, 54.

  11. Markowitz, H. 1952. Portfolio analysis, Journal of Finance, 8, 77–91.

  12. Office of United States, 2019. Notice of modification of section 301 action: China's acts, Policies, and practices related to technology transfer, Intellectual property, and Innovation, in Federal Register - The Daily Journal of the United States Government-, ed.

  13. Plerou, V., Gopikrishnan, P., Rosenow, B., Amaral, L.A.N., Stanley, H.E. 12/1/2000. A random matrix theory approach to financial cross-correlations, Physica A: Statistical Mechanics and its Applications, 287, 374–382, doi: http://dx.doi.org/10.1016/S0378-4371(00)00376-9.

  14. Prado, M.L.D. 2016. Building diversified portfolios that outperform out of sample, The Journal of Portfolio Management, 42, 59–69.

  15. Prado, M.L.D. 2018. Advances in financial machine learning. John Wiley & Sons.

  16. Prado, M.L.D. 2020. Machine learning for asset managers. Cambridge University Press.

  17. Raffinot, T. 2017. Hierarchical clustering-based asset allocation, The Journal of Portfolio Management, 44, 89–99.

  18. Shirota, Y., Chakraborty, B. 2016. Visual explanation of eigenvalues and math process in latent semantic analysis, Information Engineering Express, Information Engineering Express, 2, 87–96. [Online]. Available: http://www.iaiai.org/journals/index.php/IEE/article/view/70.


ARTICLE INFORMATION


Received: 2020-03-29
Revised: 2020-09-12
Accepted: 2020-10-17
Available Online: 2020-12-01


Cite this article:

Yamaguchi, K., Shirota, Y. 2020. Impacts of US-China trade friction on stock prices: An empirical study of machinery companies. International Journal of Applied Science and Engineering, 17, 383–391. https://doi.org/10.6703/IJASE.202012_17(4).383

  Copyright The Author(s). This is an open access article distributed under the terms of the Creative Commons Attribution License (CC BY 4.0), which permits unrestricted use, distribution, and reproduction in any medium, provided the original author and source are cited.